Earth Mapping
I have parsed many datasets in order to build up a representative map of the Earth. This series of maps hold a great variety of data geographically tagged using pixel colours. From a single pixel, representing about 40km^2 at the equator, I can iterate through the maps and acquire climate and height data. I am using these, in a long term project, to fractally subdivide the area generating a detailed 3D environment.
Below are images a few of the maps, currently I can generate the 3D environment map but without adding shading the images are difficult to distinguish. I owe all credit for the data sets to NASA, the US Geological office, and ESA. It is possible that I have missed a source, if you recognise your data in the images please contact me and I will credit you.
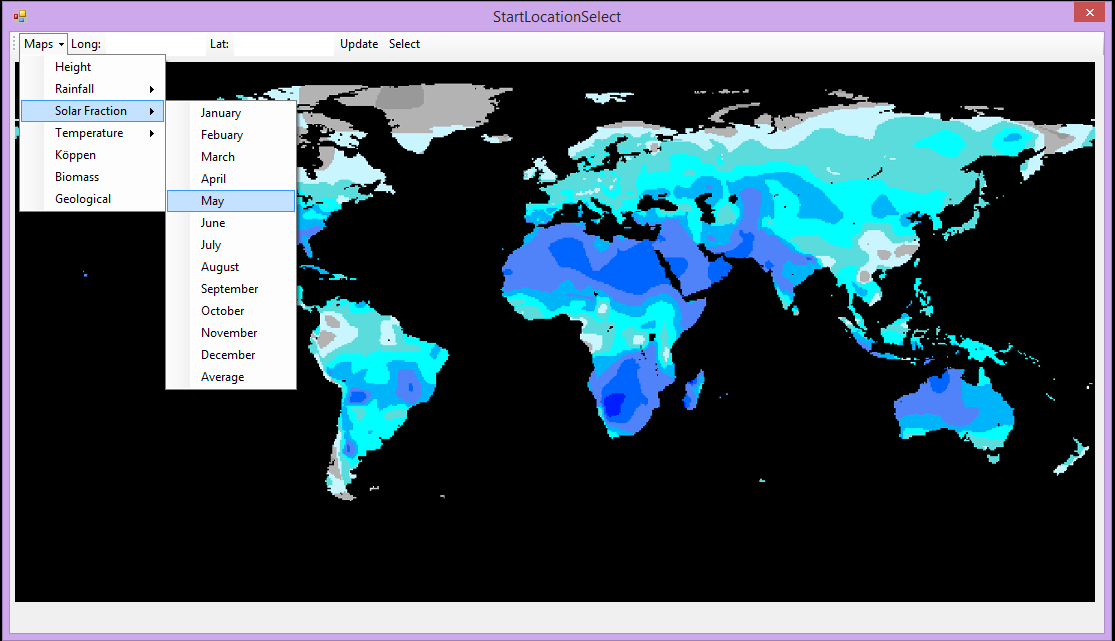
This map shows the average proportion of sunlight for a particular area.
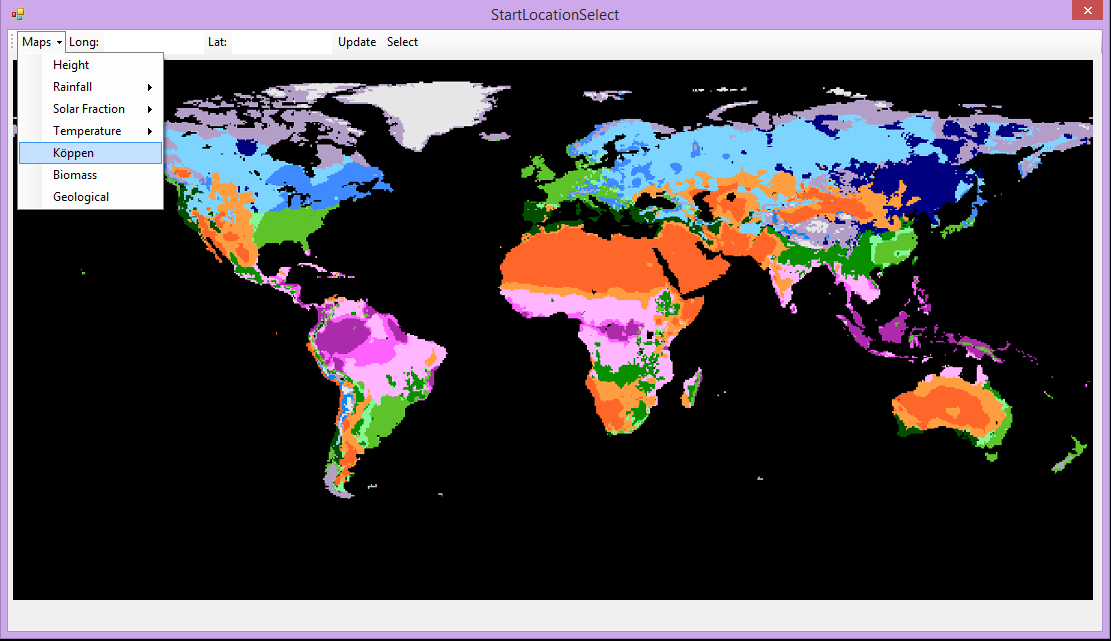
This map shows Köppen climate classification data.
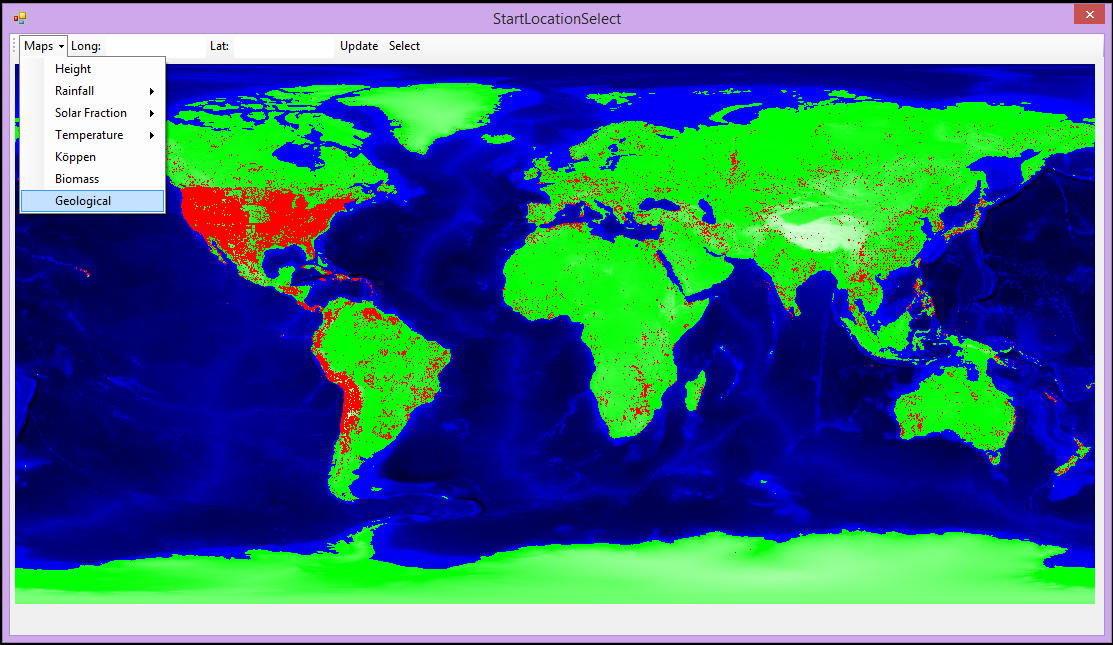
This is a combination of data sets regarding the location of many mineral deposits.